A page can load quickly and still feel slow. You tap the menu button and nothing happens for half a second. You click "Add to cart" and the button just sits there. You type in a search filter and the letters appear in bursts. None of that shows up in a load time test, but visitors feel it, and Google measures it with a Core Web Vital called Interaction to Next Paint, or INP.
INP is also the trickiest Core Web Vital to fix. Largest Contentful Paint and Cumulative Layout Shift happen while the page loads, so a single speed test usually shows the problem. INP depends on what people actually click and tap, on the devices they actually use, and on scripts that often belong to plugins or third parties rather than your own code. That makes it harder to see and harder to pin down. And because INP is measured on real visitors' devices, a fix that looks perfect on a fast development machine can make no difference at all for the people who actually use the site.
This guide takes a practical route. First, it explains what INP measures in plain language. Then it shows how to measure it with real user data, how to find the exact interaction that is slow, and the general fixes that work on any site. After that come the specific fixes for WordPress (plugins, page builders, delayed JavaScript, WooCommerce) and for Laravel (Livewire, Alpine.js, Inertia and older Blade and jQuery setups). It finishes with how INP fits alongside LCP and CLS, and how to keep it healthy once it is fixed.
Quick answer: how to improve INP
- Check your real-user INP in Search Console or PageSpeed Insights.
- Reproduce the slow interaction in the Chrome DevTools Performance panel.
- Cut JavaScript that runs while the page loads, especially third-party scripts.
- Keep event handlers short, and yield to the main thread after the visible update.
- Shrink the DOM and avoid forcing layout recalculations.
- Show instant visual feedback, so the next frame paints quickly.
What INP Measures
The three parts of every interaction
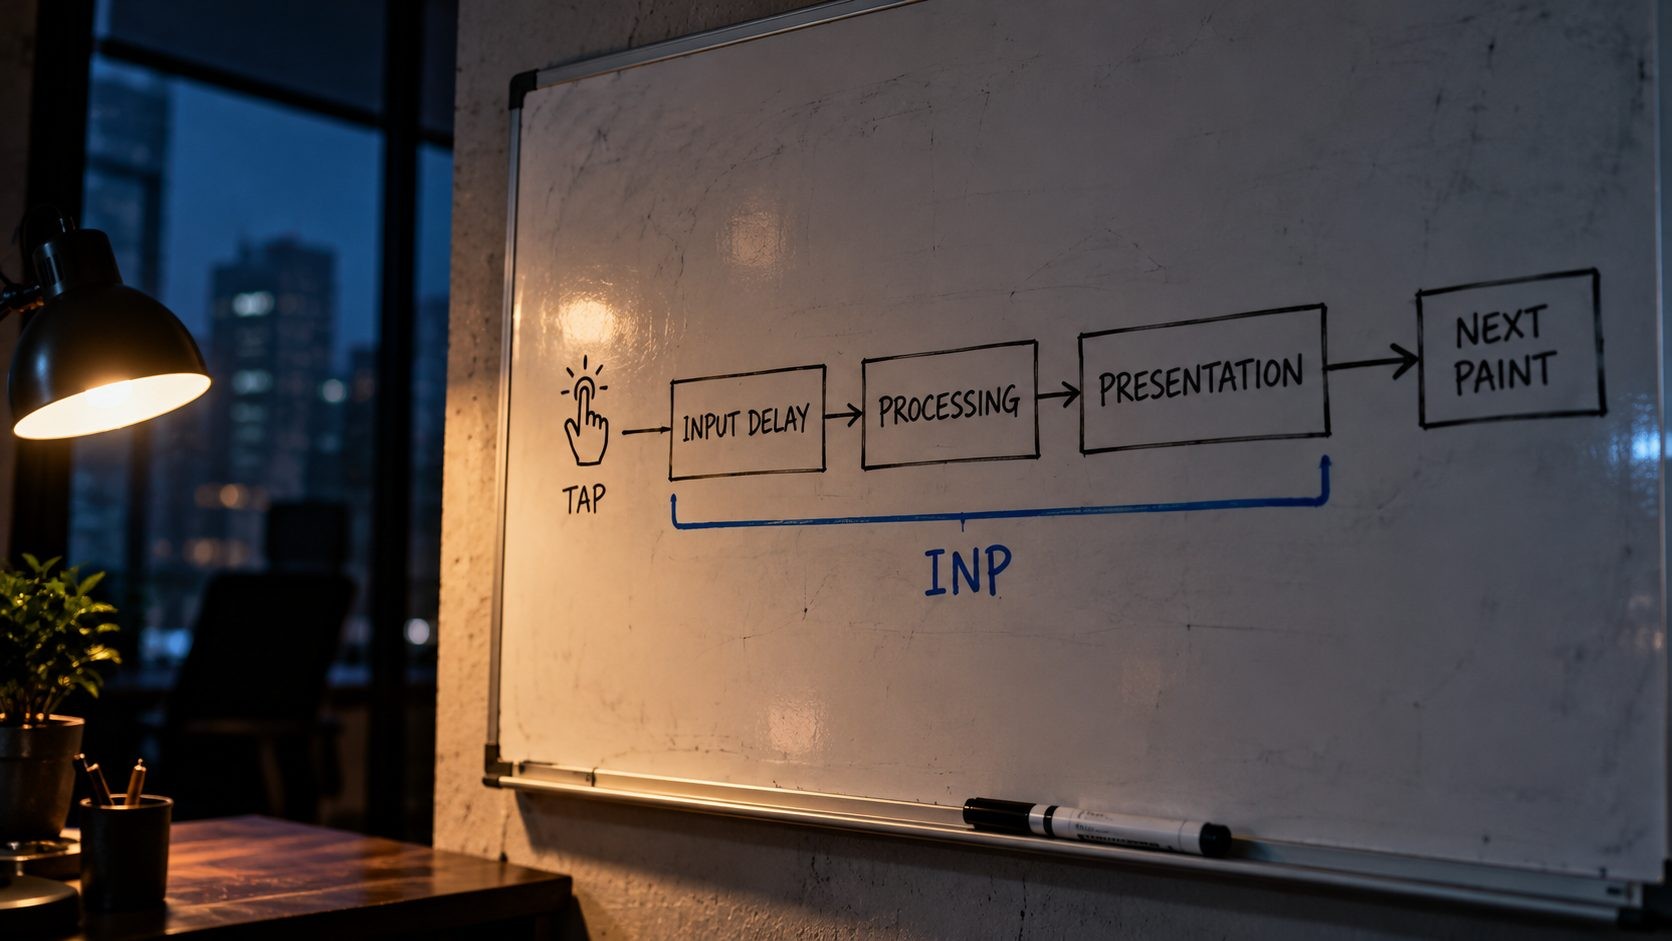
When someone clicks, taps or presses a key, the browser has to do three things before they see a response. Google's INP documentation on web.dev breaks every interaction into these parts:
- Input delay: The time between the tap and the moment your event handlers start running. If the browser is busy with other JavaScript at that moment, the interaction has to wait.
- Processing duration: The time your event handlers take to run.
- Presentation delay: The time the browser needs to recalculate styles and layout and paint the next frame on screen.
As web.dev puts it, "the sum of these three subparts is the total interaction latency." Picture a visitor tapping a mobile menu button. If a chat widget is still initializing, the tap waits (input delay). Then the menu script runs, perhaps measuring every menu item (processing). Then the browser lays out and paints the opened menu (presentation delay). INP is the time from the tap to that paint.
Knowing which of the three phases is slow changes the fix completely. A long input delay is rarely caused by the menu script itself, so rewriting the menu would not help. A long processing time points straight at the code that handles the click. A long presentation delay usually means the page is too heavy to re-render quickly. Most of the work in improving INP is figuring out which phase is the problem.
INP thresholds and scoring
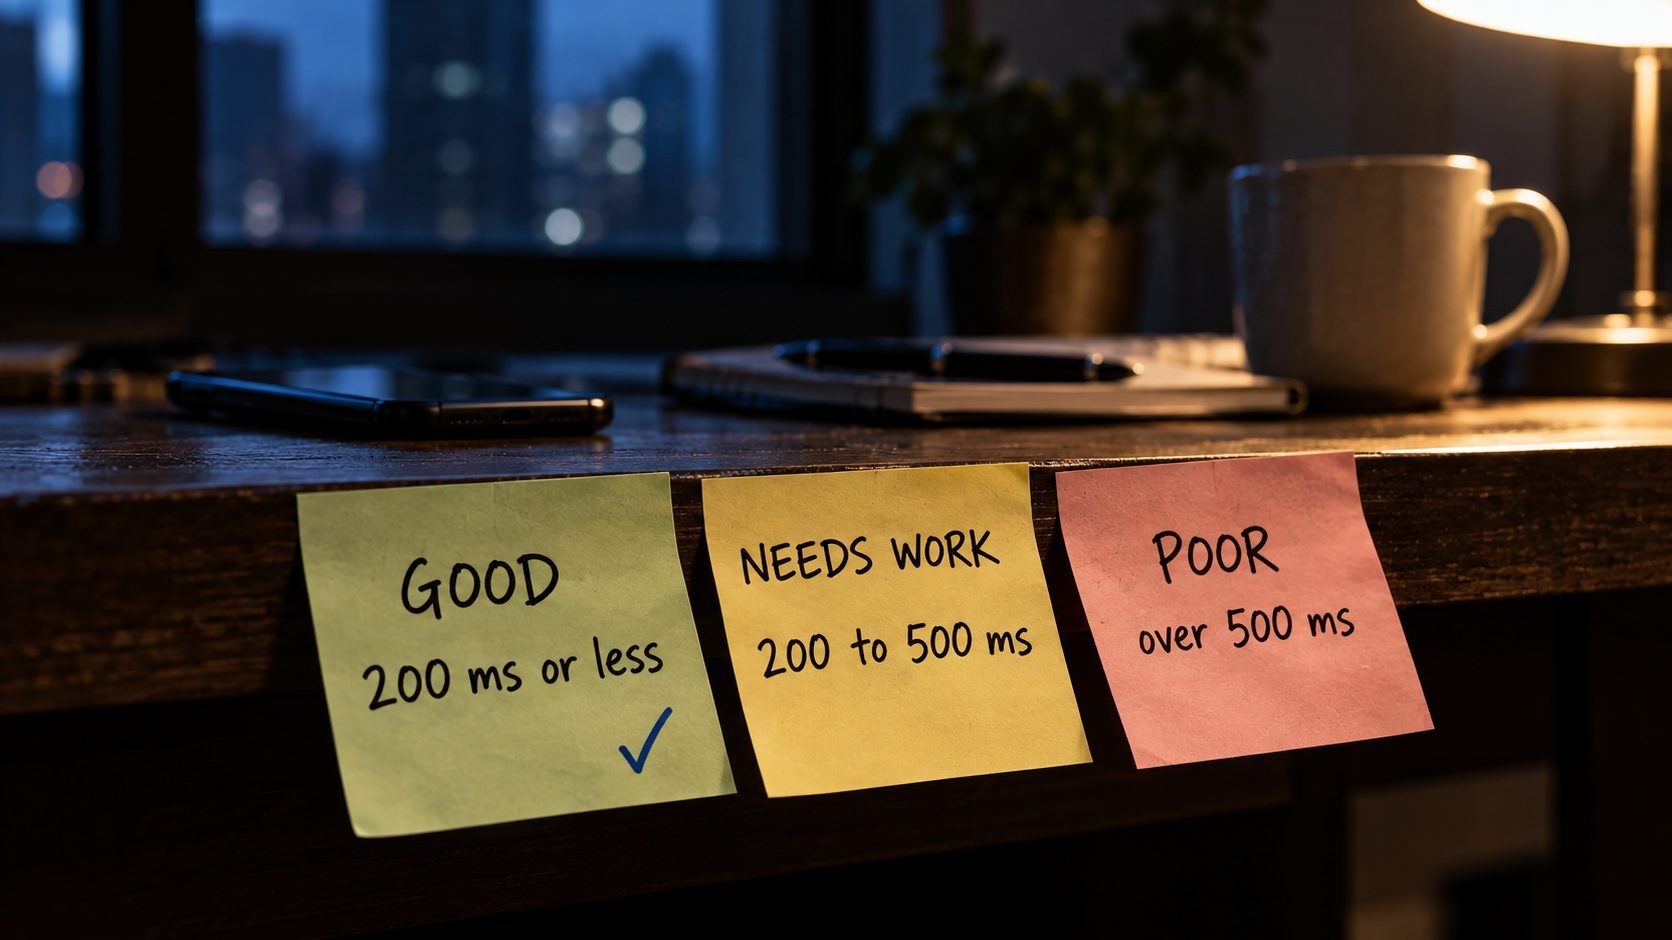
Google classifies INP using these thresholds:
| INP | Rating |
|---|---|
| 200 milliseconds or less | Good |
| Over 200 up to 500 milliseconds | Needs improvement |
| Over 500 milliseconds | Poor |
The score is based on real visits. For each page view, INP reports roughly the slowest interaction, described by web.dev as "the longest interaction observed (sometimes ignoring outliers)." Across all visits, Google looks at the 75th percentile, measured separately for mobile and desktop. That means a page passes only when at least three out of four visits have an INP of 200 milliseconds or less.
What counts and what does not
Only three kinds of interaction count: mouse clicks, taps on a touchscreen, and key presses. Scrolling, hovering and zooming are not included. INP replaced First Input Delay (FID) as a Core Web Vital in March 2024. The key difference is scope: FID only measured the delay before the first interaction was handled, while INP looks at the full time to the next paint, across interactions throughout the visit.
Why INP Is Harder to Fix Than LCP or CLS
Three things make INP more difficult than the other Core Web Vitals.
First, it needs real interactions. A lab test such as Lighthouse loads the page but does not click your menus, filters or forms the way visitors do, so it cannot measure INP directly. Lighthouse reports Total Blocking Time instead, which is a useful hint because long tasks during load often cause input delay, but it is only a proxy.
Second, the slow interaction is usually specific. A page might feel fine everywhere except when someone opens the product variation dropdown, or types in a live search box, or taps the cookie banner's "Accept" button. Unless you know which interaction is slow, you end up optimizing the wrong things.
Third, devices matter more than for any other metric. INP is mostly about how fast the main thread can run JavaScript and render, and mid-range phones are far slower at that than a developer's laptop. That is why mobile INP is often much worse than desktop INP for the same page, and why a page can feel perfectly smooth when you test it yourself.
There is also a timing problem. Field data in Search Console covers 28 days, so a change you make today takes weeks to show up there. Without a way to test interactions yourself, it is easy to spend a month waiting to find out that a fix did not work. The workflow below avoids that by using field data to find the problem and lab testing to confirm each fix straight away.
The good news is that once you find the slow interaction, the fixes are usually concrete: less JavaScript running at the wrong time, shorter event handlers, and less rendering work.
Step 1: Measure INP in the Field
Search Console's Core Web Vitals report
Start in Google Search Console under Core Web Vitals. The report groups similar URLs together and labels each group as good, needs improvement or poor, separately for mobile and desktop. Open the mobile report first and look for groups failing on INP. Because groups usually follow your templates, this quickly tells you whether the problem is on product pages, blog posts, the homepage or everywhere. The data covers the previous 28 days, so it reflects real visitors but changes slowly.
Click into a failing group to see example URLs. Pick one or two that get real traffic and represent the template well, because those are the pages you will test in the next step. If the report says there is not enough data for your site, skip ahead to the section on sites without field data.
PageSpeed Insights field data
Next, run a key page through PageSpeed Insights. The top section, "Discover what your real users are experiencing", shows INP from the Chrome User Experience Report (CrUX) for that URL if it has enough traffic, or for the whole origin if it does not. Compare the URL-level and origin-level numbers. If the origin fails but a particular page passes, the problem lives on other templates. This guide on how to read a PageSpeed Insights report explains the difference between field and lab data in detail.
When there is no field data
Small or new sites often have no CrUX data at all. In that case, you have two options. The first is to add real user monitoring. Google's open source web-vitals JavaScript library has an attribution build that reports INP along with which element was interacted with and which phase was slow, and you can send that data to your analytics. Several commercial monitoring tools do the same with dashboards. The second option is to use lab signals as a rough guide: a high Total Blocking Time in Lighthouse, and the interaction testing in Step 2. Lab testing will not give you the exact field score, but it will find most of the same problems.
If you add real user monitoring, pay attention to which elements show up most often in slow interactions. A report that says most of your poor INP comes from taps on the same filter button or menu toggle is far more useful than a single average score, because it tells you exactly where to start.
Step 2: Find the Slow Interactions in the Lab
Once you know which pages fail, reproduce the problem yourself. The Chrome DevTools Performance panel is the best free tool for this.
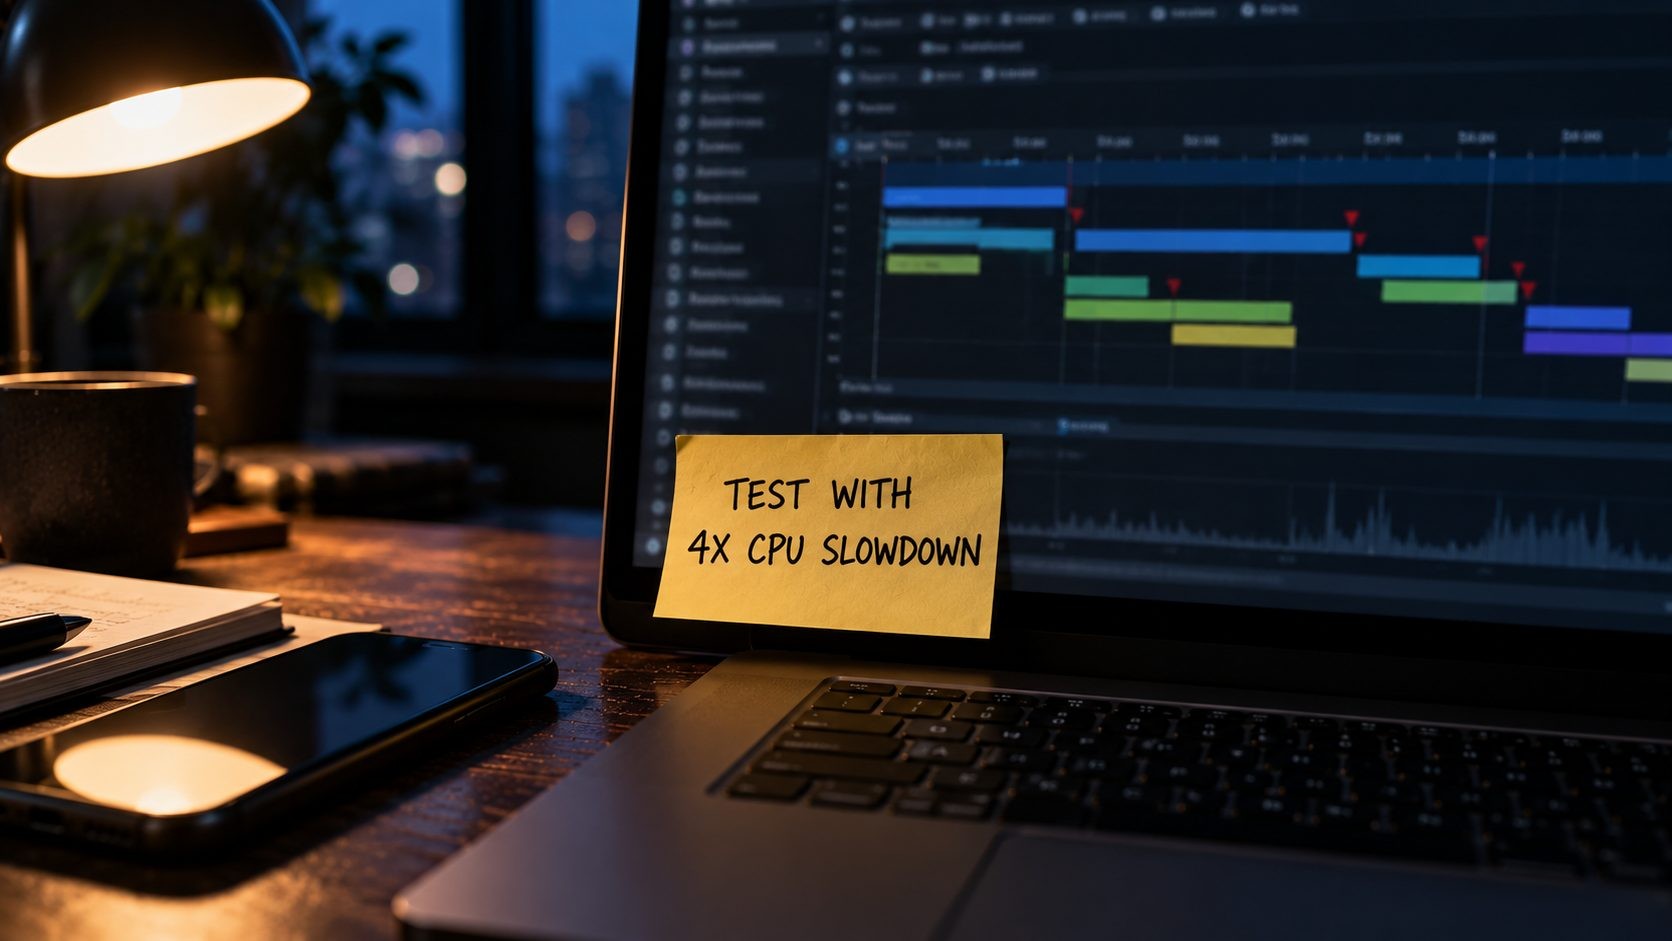
- Open DevTools on the failing page and go to the Performance panel. It immediately shows local LCP and CLS, and once you interact with the page, it captures your local INP and its score.
- Throttle the CPU. In the panel settings, slow the CPU down (for example 4x or 6x) to roughly simulate a mid-range phone. Without throttling, a fast laptop hides most INP problems.
- Interact like a visitor. Open the menu, use filters, add to cart, type in search, accept the cookie banner. Then check the Interactions tab, which lists each interaction with the element involved, its timing and its phases.
- Record a trace for the slowest interaction. Click record, repeat the interaction, then stop. In the trace, look for long tasks (marked with red corners) around the interaction, and follow them down to see which scripts and functions took the time.
- Compare with field data. The panel can fetch CrUX field data and show it next to your local numbers, which helps confirm you are reproducing the same problem real visitors have.
Test each important interaction a few times. The first interaction after load is often slower than later ones, because scripts are still initializing, and that first impression is exactly what real visitors experience.
The phase breakdown tells you where to look. Long input delay points to other scripts running when the user tapped. Long processing points to your event handlers. Long presentation delay points to rendering work, usually a large DOM or expensive layout.
For production monitoring, the Long Animation Frames API, which shipped in Chrome 123, gives deeper attribution: it reports which scripts were running during slow frames, including ones that were not part of the interaction itself. Real user monitoring tools and the web-vitals attribution build use it to show which script caused a slow interaction in the field.
Make a short list as you test: the interaction, the page, the INP you measured, the slow phase and the script responsible. That list becomes your fix plan. It also stops you from chasing problems that only appear once, because an interaction that is slow every time you try it is the one to fix first.
General INP Fixes That Work on Any Site
Reduce input delay
Input delay happens when the main thread is busy at the moment someone interacts. The most common cause is JavaScript that runs during and shortly after page load: framework start-up code, analytics, tag managers, chat widgets, consent banners, A/B testing tools and ad scripts. If a visitor taps a button while a 300 millisecond script is running, they wait up to 300 milliseconds before anything starts.
To reduce it:
- Load less JavaScript. Remove scripts you do not need, and load scripts only on the pages that use them.
- Defer non-critical scripts so they do not compete with the page's first interactions.
- Delay third-party tags that are not needed immediately, such as chat widgets and heatmap tools.
- Break up long start-up tasks in your own code, so the browser can respond to input between them.
- Watch for timers and intervals. Scripts that run every few hundred milliseconds, such as carousels, live counters or polling code, can be running exactly when the user taps.
Input delay can also come from a previous interaction. If one click starts a long task, a second click made shortly afterwards has to wait for it to finish. That is another reason to keep every handler short, even ones that do not look slow on their own.
Keep event handlers short and yield to the main thread
When an event handler runs, the browser cannot paint until it finishes. The fix is to do the work the user needs to see first, then let the browser paint, then do the rest. web.dev's guide to optimizing INP recommends breaking long work into separate tasks, and notes that "yielding indiscriminately is better than not yielding at all."
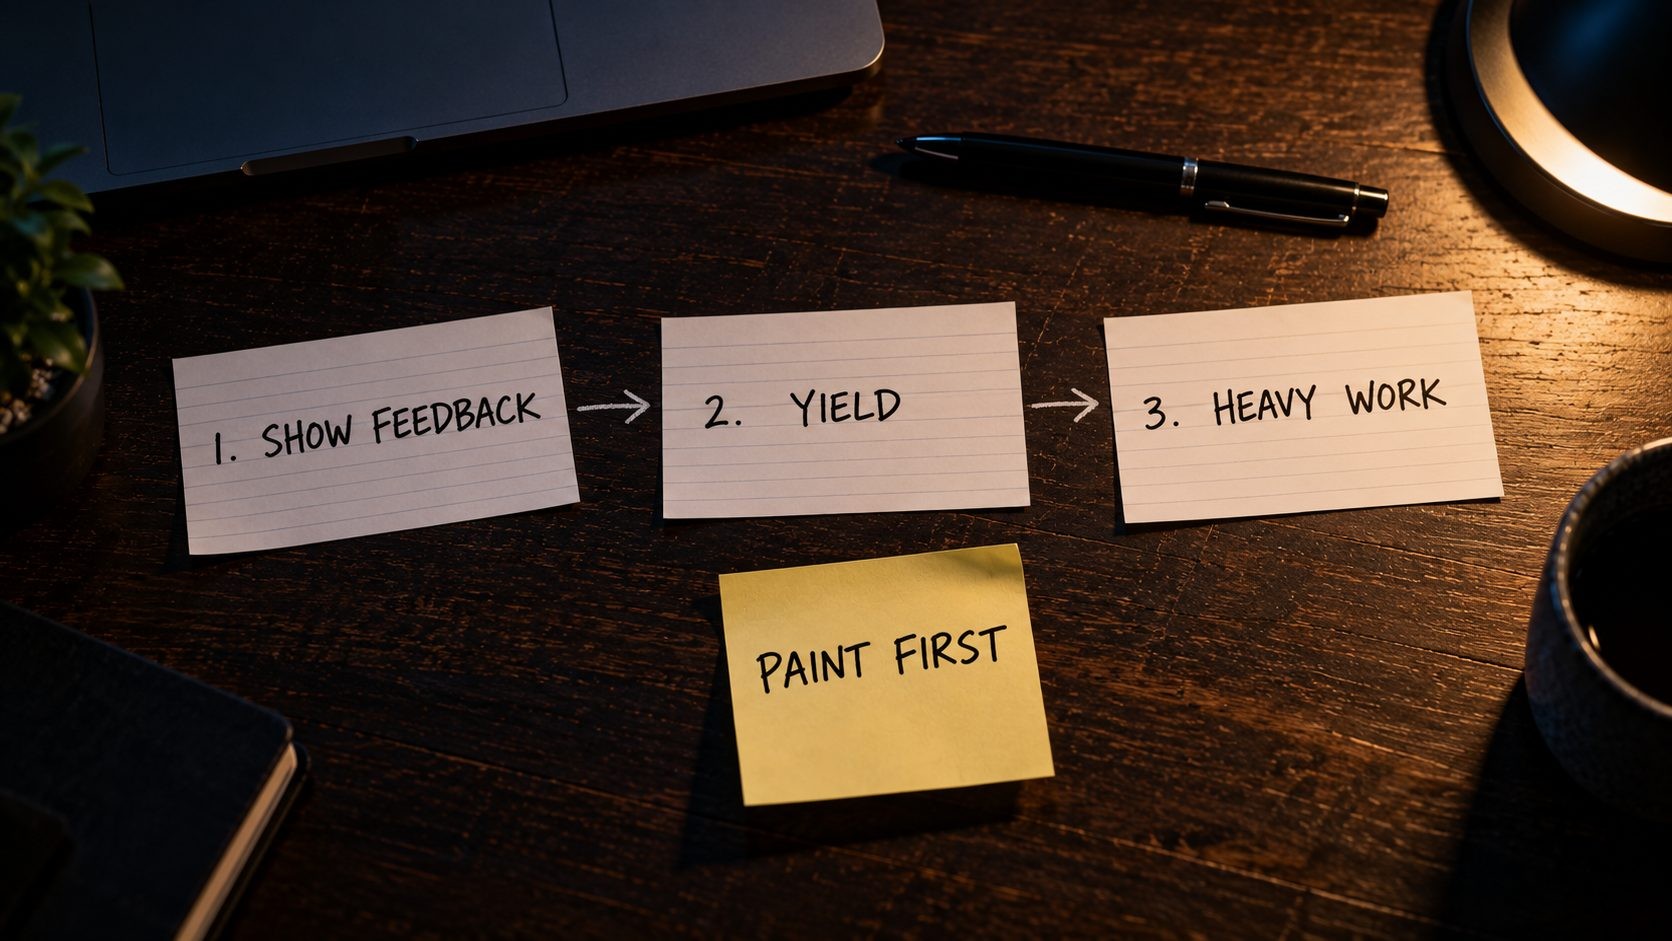
The modern way to yield is scheduler.yield(), but it is not yet supported in every major browser, so use it with a fallback:
js
// Yield control back to the main thread so the browser can paint and respond to input.
function yieldToMain() {
  if (globalThis.scheduler?.yield) {
    return scheduler.yield();
  }
  return new Promise((resolve) => setTimeout(resolve, 0));
}

button.addEventListener('click', async () => {
  // 1. Do the visible update first.
  button.classList.add('is-loading');
  panel.hidden = false;

  // 2. Let the browser paint that change.
  await yieldToMain();

  // 3. Then do the slower work.
  updateFilteredResults();
  sendAnalyticsEvent('filter_opened');
});
Other habits that shorten processing time: debounce handlers that fire on every keystroke, avoid doing the same expensive calculation on every interaction, and move heavy work that does not touch the page, such as large data processing, into a Web Worker.
Be careful with work you add to handlers "just in case". Analytics events, logging, saving preferences and prefetching are all useful, but none of them needs to happen before the screen updates. Moving them after the yield, or sending them with navigator.sendBeacon() where appropriate, often shortens processing time noticeably without changing what the user sees.
Reduce presentation delay
After your code runs, the browser still has to recalculate styles, lay out the page and paint. That work grows with the size and complexity of the page.
- Keep the DOM small. Very large pages, deeply nested page builder markup and huge menus make every style and layout update more expensive.
- Use
content-visibility: autoon large sections that start off-screen, so the browser can skip rendering them until they are near the viewport:
css
.long-section {
  content-visibility: auto;
  contain-intrinsic-size: auto 800px;
}- Avoid layout thrashing. Reading layout values (such as
offsetHeightorgetBoundingClientRect()) right after changing styles forces the browser to calculate layout synchronously, and doing it in a loop can be very slow. Read all the values you need first, then make all the changes. - Animate cheaply. Prefer animating
transformandopacityrather than properties that trigger layout, such asheight,toporwidth.
Give instant visual feedback
INP measures the time to the next paint, not the time until all work is finished. That is good news: if the first thing your handler does is show a pressed state, open the panel or display a spinner, and the rest of the work happens afterwards, INP stays low even when the full operation takes longer. Visitors also feel the difference. A button that reacts instantly and then shows a loading state feels faster than one that freezes and then jumps.
This only works if the feedback can actually paint. If you add a loading class and then immediately run a long synchronous task in the same handler, the browser cannot show the loading state until the task finishes. Pair visual feedback with the yielding pattern above, so the change reaches the screen before the heavy work starts.
How to Improve INP on WordPress
Audit plugins and load scripts only where needed
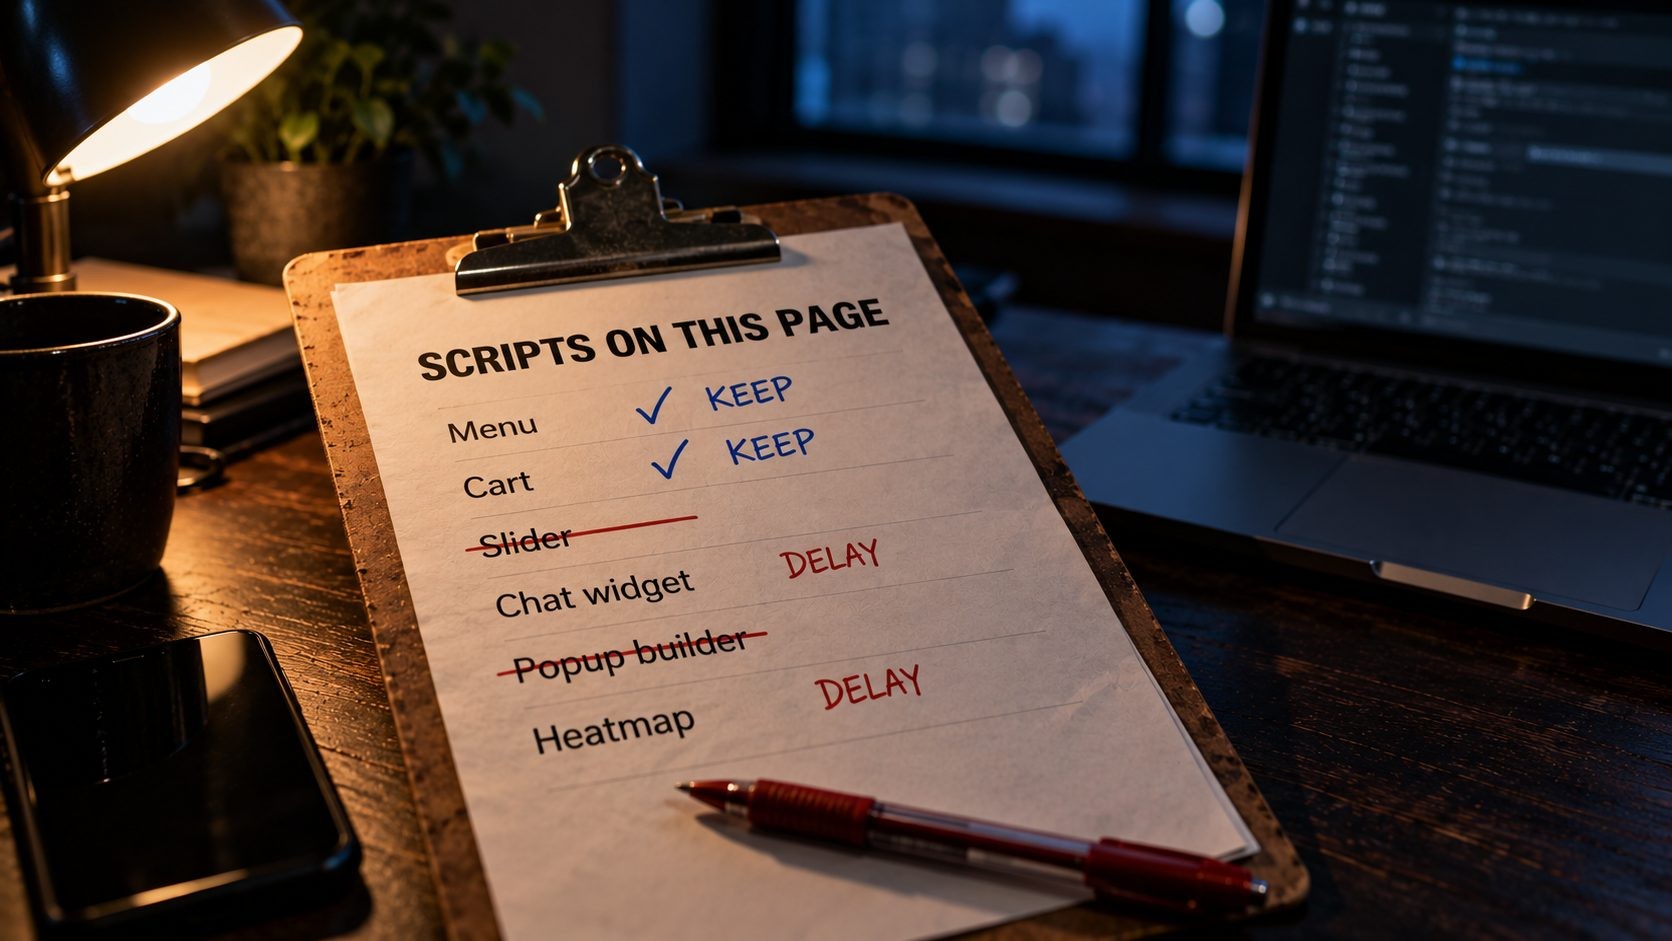
WordPress INP problems usually come from the combined JavaScript of plugins, themes and third-party tags. Start by listing every script loaded on your slowest template (the Network panel in DevTools filtered to JS works well). For each one, ask whether this page actually needs it. Slider scripts on pages without sliders, form plugin scripts on pages without forms and popup builders loaded sitewide are all common. Many performance plugins let you disable scripts per page or per post type, and some themes and plugins include settings to load assets only where they are used. Removing a script entirely is always better than optimizing it.
Also check which plugins add JavaScript to the front end without you noticing. Some plugins that look back-end only, such as related posts, social sharing, review widgets and membership tools, load scripts on every page. Deactivating plugins one at a time on a staging copy and retesting the slow interaction is slow but reliable, and it often finds a single plugin responsible for most of the problem.
Delay or defer JavaScript carefully
Most WordPress performance plugins can defer or delay JavaScript. WP Rocket's "Delay JavaScript execution" option, for example, waits to load scripts "until there is a user interaction" such as moving the mouse, scrolling, touching the screen or pressing a key, and Perfmatters and LiteSpeed Cache offer similar delay options. Delaying non-critical scripts reduces the work during page load, which helps input delay and Total Blocking Time.
There is a catch for INP. If many delayed scripts all load and run at the first interaction, that first click or tap can become slow, because the browser has to download and execute everything at once. To avoid this, exclude scripts that power above-the-fold interactions, such as the menu and the cart, from the delay, and only delay genuinely optional scripts like chat, heatmaps and social embeds. Test the first interaction specifically after enabling any delay feature. In the DevTools Performance panel, reload the page, wait a few seconds without touching it, then click the menu and check the interaction's processing time. If it jumps compared with the second click, the delayed scripts are landing on that first interaction. Cloudflare's Rocket Loader works on a similar idea and often conflicts with these plugins, which is why this guide to Cloudflare settings for WordPress recommends keeping it off unless tested.
Tame page builders, sliders and mega menus
Page builders tend to produce deep, heavily nested markup and load large script bundles on every page, which raises both processing and presentation delay. Sliders, carousels and animated mega menus add their own handlers and layout work. Simplify where you can: use fewer nested sections, remove animations that run on every scroll or hover, replace sliders with static images, and keep mobile menus short and simple. For sites where INP matters a lot, a lean custom theme gives you control over exactly what loads, which is one of the main advantages covered in this guide to custom WordPress theme development. Newer block-based features built on WordPress's Interactivity API, introduced in WordPress 6.5, are also generally lighter than older jQuery-based equivalents.
Put third-party tags on a diet
Third-party scripts are among the most common causes of poor INP, and you cannot optimize their code. You can only control whether and when they load:
- Chat widgets: Load them after a delay or when the visitor clicks a "Chat with us" button, using a lightweight placeholder (often called a facade) until then.
- Video and map embeds: Show a static preview image and load the real embed on click.
- Tag managers: Review every tag inside them. Old campaign pixels and duplicate analytics tags often keep running long after anyone uses their data.
- Consent banners: Choose a lightweight consent tool and test the "Accept" click itself, because it often triggers many scripts at once.
- Social and review widgets: Replace live feeds with static content or load them only when the visitor scrolls near them.
A useful rule is to ask, for each third-party script, what would happen if it loaded ten seconds later. For most chat, feedback and marketing tools, the answer is "nothing important", which makes them good candidates for delaying.
WooCommerce interactions
On stores, the interactions that matter most are often the slowest: choosing product variations, adding to cart, applying AJAX filters and updating the cart. Variation selectors that recalculate prices and images on every change, filter plugins that re-render large product grids, and cart scripts that run on every page can all hurt INP. Use lighter filter plugins, debounce filters that update on every change, show an immediate loading state when filters or cart buttons are clicked, and avoid loading cart-related scripts on pages where nobody can add to cart.
Product pages with many variations deserve special attention. When every change to size or color triggers price, stock and image updates plus gallery reinitialization, the interaction can easily take hundreds of milliseconds on a phone. Test the variation selector specifically with CPU throttling, and check whether the theme or a gallery plugin is doing more work than needed on each change.
What hosting can and cannot do
Hosting is often blamed for poor INP, but INP is measured in the browser, from the interaction to the next paint. If a click sends an AJAX request to admin-ajax.php and the page shows a loading state immediately, the server response time is not part of INP, because the browser has already painted the feedback. A slow server still matters for Time to First Byte, for LCP and for how fast the whole action feels, but it rarely fixes INP on its own. If your INP is poor, look at JavaScript and rendering first. If the whole site is slow, this guide to why your website is slow covers server and hosting causes.
How to Improve INP on Laravel Sites
Livewire
Livewire makes interactive interfaces easy to build, but each update can mean a network round trip and a DOM update, and both can affect how responsive the page feels.
- Be selective with
.live. According to Livewire's wire:model documentation, a plainwire:modeldoes not send a request until an action runs. Adding.livesends updates as the user types, with a default debounce of 150 milliseconds. Use.liveonly where real-time updates are needed, and prefer.bluror.changefor normal form fields.
blade
{{-- Live search: update after the user pauses typing --}}
<input type="text" wire:model.live.debounce.300ms="search">

{{-- Normal field: sync when the user leaves the input --}}
<input type="text" wire:model.blur="company_name">
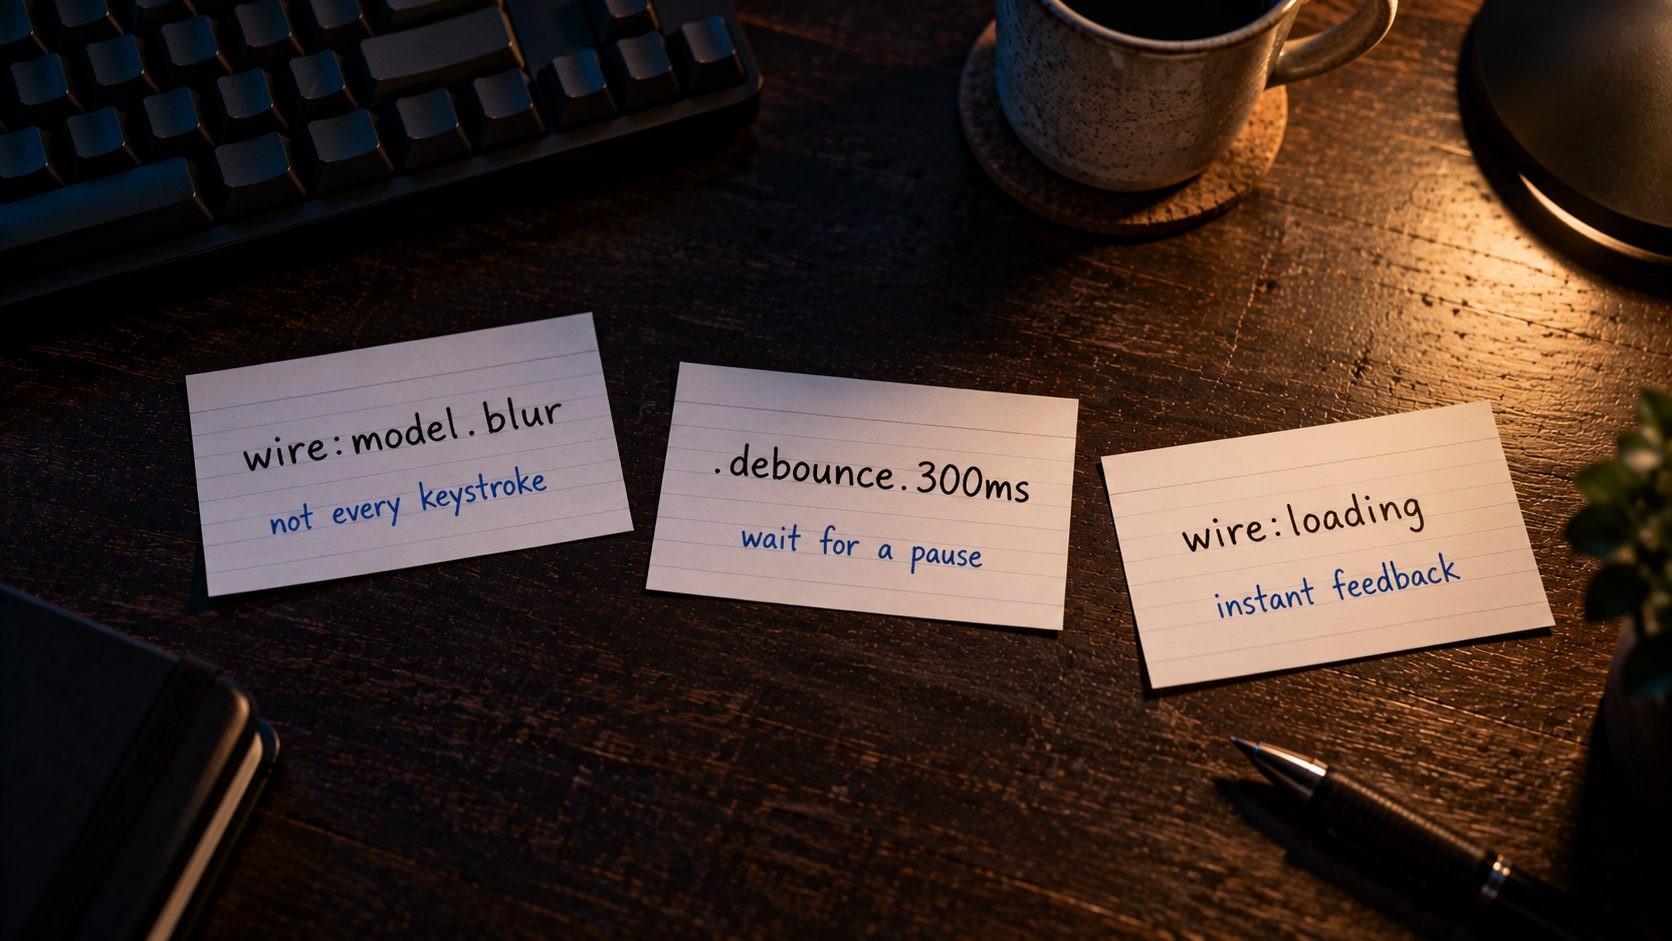
- Show feedback immediately. Use
wire:loadingto show a loading state the moment an action starts, so the browser paints a response straight away instead of waiting for the server.
blade
<button wire:click="save">
    <span wire:loading.remove wire:target="save">Savespan>
    <span wire:loading wire:target="save">Saving...span>
button>- Keep components small. When a large component re-renders, Livewire has to patch more of the DOM. Split big pages into smaller components so each interaction updates only what changed.
- Avoid giant lists in one component. Paginate or lazy-load long tables and lists rather than rendering hundreds of rows that update together.
- Use keys on repeated elements. Adding
wire:keyto items in loops helps Livewire match elements correctly when the list changes, which avoids unnecessary DOM work and odd re-rendering bugs.
When you profile a Livewire page in DevTools, separate the two halves of the problem. If the slow part is the time before the request is sent or after the response arrives, it is front-end work and affects INP. If it is the wait for the server, it affects perceived speed and should be fixed on the back end.
Alpine.js
Alpine handles many small interactions in Laravel apps. Keep its work light:
- Debounce input handlers that filter or search, for example with
x-on:input.debounce.300ms. - Avoid large
x-forloops that re-render many elements on every change. Filter on the server, paginate, or render fewer items. - Keep watchers and computed values cheap, because they can run on every state change.
- Use
x-showfor elements that toggle often, such as dropdowns and tabs, because it only changes visibility, whilex-ifadds and removes elements from the DOM each time.
Alpine is light by design, so problems usually come from what it is asked to do rather than from Alpine itself. A dropdown that filters a list of 2,000 options on every keystroke will be slow in any framework.
Inertia with Vue or React
Single-page setups move more work into the browser, so bundle size and rendering cost matter more.
- Code-split by page. Vite can load each Inertia page's JavaScript separately, so visitors do not download and parse the whole app up front.
- Avoid re-rendering whole pages when a small piece of state changes. Keep state close to the components that use it.
- Virtualize long lists and tables, so only visible rows are rendered.
- Memoize expensive components and calculations that do not need to rerun on every interaction.
- Use partial reloads. Inertia lets you reload only specific props instead of the whole page's data, which reduces both the data sent and the amount of the page that re-renders.
The framework's own developer tools help here. Vue DevTools and React DevTools can show which components re-render on each interaction, and that is often where the extra processing time hides.
Blade pages with legacy jQuery and plugins
Many Laravel apps still have older Blade layouts that load jQuery, several jQuery plugins and a large app.js on every page. Audit those layouts the same way you would a WordPress theme: remove libraries nobody uses, load page-specific scripts only on the pages that need them, use event delegation instead of attaching handlers to hundreds of elements, and defer scripts that are not needed for the first interactions.
If you are moving these pages to Vite, take the chance to split the bundle by page or feature rather than recreating one large file. Old datepickers, select replacement plugins and table libraries are frequent offenders, and modern browsers now offer native alternatives for many of them, such as date inputs and the
Get new posts by email
New guides and alerts, sent when they are published. No spam. Unsubscribe anytime.

Comments (0)